Posted by Brian on August 3, 2017 · Leave a Comment
Senate Approves Resolution Creating Task Force to Investigate Threat of Lead Exposure in Pennsylvania
Senator John T. Yudichak recently announced that Senate Resolution 33 — which creates a bipartisan task force to investigate the scope of Pennsylvania’s lead exposure problem — was approved unanimously by the full Senate. The resolution had been approved unanimously by the Environmental Resources and Energy Committee at the end of April.
Senator Yudichak introduced the resolution earlier this session because lead exposure can threaten the health and well-being of every Pennsylvanian—especially senior citizens and children. “The task force report will advance cooperative efforts to arm the General Assembly with better information and best practice recommendations to develop new lead abatement programs that more aggressively mitigate lead exposure in Pennsylvania,” said State Senator John Yudichak.
[amazon_link asins=’B00IJG4X50′ template=’ProductAd’ store=’webdespro-20′ marketplace=’US’ link_id=’24f7140f-b2bb-11e7-a067-bbd7473f7890′]
The resolution calls for the Senate to establish a task force on lead exposure comprised of the chairs of the Environmental Resources and Energy Committee and the Health and Human Services Committee and two members appointed by the Senate President pro tempore and the Minority Leader. An advisory committee of the Joint State Government Commission will conduct a comprehensive review of Pennsylvania law and public policy related to lead exposure and abatement practices and then submit a report to the task force and full Senate within 18-months. The report must assess the age of housing and infrastructure, lead exposure threats, and identify the prevalence of lead in structures where children spend significant time.
A few key points
- This is not just a drinking water issue. Lead is present in many homes and sources include old lead paint, cookware, make-up, and other consumer products.
- If on city water, check piping in home for lead pipe and evidence of corrosion. Remove the aeration devices and clean and flush the water lines to remove any films and coatings.
- If on city water – read the Consumer Confident Reports generated by water supplier and look for signs of corrosion.
- If on well water – get your water tested.
- Use are free phone App – Know Your H20 – Android / Google ; Apple
Filed under Children's Health, city water testing, environmental education, Environmental Hazards, Environmental Health, lead, Pennsylvania, Water Testing, Well, Well water testing · Tagged with city water, environmental lead testing, Lead, lead dust, lead paint, Pennsylvania Lead Task Force, Phone App, Water Testing, well water
Posted by Brian on August 3, 2017 · 1 Comment
Announcement: Wyoming Valley Sanitary Authority Launches Regional Stormwater Management Project
“On the banks of the Susquehanna River, the Wyoming Valley Sanitary Authority (“WVSA”) recently launched an innovative regional stormwater management project that could be a springboard for other cooperative efforts between the region’s municipalities. Senator John T. Yudichak, Department of Environmental Protection (“DEP”) Secretary Patrick McDonnell, and representatives from more than 30 municipalities from Luzerne County announced the joint venture on the River Commons in Wilkes-Barre.
Under the plan, the WVSA will coordinate and implement a regional and comprehensive stormwater management program that will reduce pollution of the Susquehanna River and help Pennsylvania meet its obligations under the Chesapeake Bay Agreement. Under existing federal law, municipalities in Northeastern Pennsylvania must curb pollution of the Susquehanna River by as much as 10% in the next five years or each community could be penalized for failure to comply with federal law. The Environmental Protection Agency (“EPA”) regulations are intended to keep harmful contaminants out of the river and minimize each community’s environmental impact upon the river and downstream communities. As the EPA targeted reductions are met, the Susquehanna River will become cleaner thereby making it safer for wildlife as well as for fisherman, kayakers, and other sportsmen to enjoy.
The WVSA will assume the lead–on behalf of member municipalities–to finance capital projects, submit all stormwater management plans and permit applications, and implement pollution control measures throughout its service area that will reduce stormwater pollution to meet the EPA’s benchmarks. The U.S. Army Corps of Engineers, Baltimore District, will be assisting with stormwater mapping as part of the program.
“The WVSA is well-prepared to meet this challenge and we are eager to advance this project after months of planning,” said Jim Tomaine, Executive Director of the WVSA. “Over the next five years, we will reduce pollutants contaminating the Susquehanna River, which will improve water-quality.” By working together, the WVSA estimates that the region will save $57 million over five years and $274 million over the next two decades, in present-value dollars. Individual households will pay a nominal fee—anywhere between $3 and $4.50 monthly—to the WVSA to finance the regional effort. The WVSA estimates that households will pay between 70% and 90% less than if their municipality pursued EPA compliance on its own. “We all have a responsibility to clean up the Susquehanna River and the Chesapeake Bay because no single municipality could meet this obligation alone,” said Senator Yudichak. “The regional stormwater project—designed to improve water quality and wildlife habitats throughout the watershed—represents the most comprehensive environmental project in northeast Pennsylvania in the last forty years.”
Learn More about Senator Yudichak (14th Senate District)
Filed under acid mine drainage, Clean Water Act, Community Health, environmental management, stormwater, wastewater, Water · Tagged with luzerne county, Senator Yudichak, stormwater, susquehanna, susquehanna river, Wilkes Barre, Wyoming Sanitary Authority
Posted by Brian on July 4, 2017 · Leave a Comment
“Sedimentary layers record the history of Earth. They contain stratigraphic cycles and patterns that precisely reveal the succession of climatic and tectonic conditions that have occurred over millennia, thereby enhancing our ability to understand and predict the evolution of our planet. Researchers at the University of Geneva (UNIGE), Switzerland, — together with colleagues at the University of Lausanne (UNIL) and American and Spanish scientists — have been working on an analytical method that combines observing deep-water sedimentary strata and measuring in them the isotopic ratio between heavy and light carbon. They have discovered that the cycles that punctuate these sedimentary successions are not, as one might think, due solely to the erosion of mountains that surround the basin, but are more ascribable to sea level changes. This research, which you can read in the journal Geology, paves the way for new uses of isotopic methods in exploration geology.”
Read More at “Sea level as a metronome of Earth’s history”
Different Perspective on Climate (Climate Science News)
Suggested Reading:
Paperback – Illustrated, January 20, 2012.
Posted by Brian on June 23, 2017 · Leave a Comment
100% Renewable is the a Realistic Goal or a No Pipe Dream
This is not a standard article but a look just specifically at the issue of energy. To set some basic ground rules we have to agree on some facts:
We are not in an energy crisis, we are in a crisis related to energy waste and poor and ineffective distribution and storage.
1. We waste over 58 % of the energy we use in the USA.
2. This energy waste is double what we actually need.
3. This annual energy waste, production, lack of use, distribution inefficiencies, and waste heat, in just one year in the USA could power the UK for 7 years.
4. We are leaving money on the table that could go economy and help our countries and others.
Inefficient Production
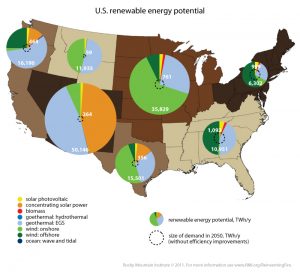
1. Wind and solar have low inefficiencies for energy production compared to other source. So they really only make sense NOW in specific corridors or regions. 
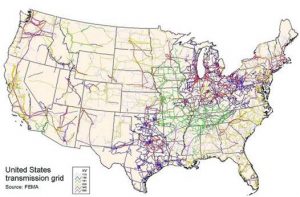
2. The primary problem is these regions are not were the core demand in the USA is located and we lack an energy distribution network. 
3. Inefficient distribution, production, and waste requires building multiple times demand capacity to meet peak demand. Because of the lack of solid storage systems, such as battery technology, inefficient distribution and production we need to overbuild to meet peak capacity if we rely sole on renewable. A thought process:
How to Get There !- 1 Quadrillion Btus per year = 2,739,730,000,000 BTUs/day
Solar (100 % Efficiency) – 433 Btu/hr per square foot
Available 24 hours per day
Need 6100 acres of Solar Panels
Wait – Solar-Assume Solar Efficiency Assume 10% (high) – Only Available about 8 hours per day
Need 182,000+ acres of Solar Panels, plus storage and duplicate capacity.
Wind- 25 % Conversion
Need about 270,000 10 MW Turbines, plus storage and duplicate capacity.
These analysis does not factor in transmission losses. If there was only a 10% loss and no other inefficiencies, we would multiple the calculated values by 1.1, but we have a use inefficiency of 58%. This means are multiplication factor is at least 1.9 to 2 +. So – 360,000 acres of solar panels and 540,000 10 MW turbines.
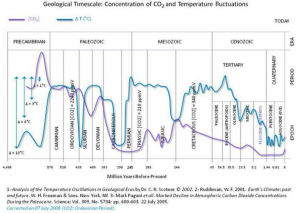
The goal for renewable should not be based on a Carbon or CO2 hammer and we must stop this myth of Man controlled climate. Climate on this Earth has not been constant, it is in dynamic equilibrium with Sun, Earth Process, and to a lesser extent life on Earth.
It is very likely man is having an influence on the climate, but this is not likely CO2 production but deforestation, building in the wrong places, heat island effects, and not adapting to our environment. As an alternative approach, we are suggesting the following:
- Fact based discussions about energy, economy, politics, and culture. We are humans so science (facts) and cultural discussions are linked, but we should not be using Fear as a rally cry.
- Concentration on energy waste reduction – individuals, homes, small business, and government.
- Distribution – We should focus on “hardening” the grid and creating capacity and duplicity were needed. We must start linking “renewable and other energy sources” and take advantage of the energy diversity in the USA.
- Storage – we must develop efficient storage technologies.
- The solution is not a CO2 hammer, electric cars, or a 100% renewable life cycle, but an all the above approach.
- Remember our beaches are moving, we live on a planet with the plates move and we have the Great Earth Engine. (Geothermal is a great asset for the USA).
- Energy and energy technology – we must not be hoarders, but exports of energy and energy technology and I do not mean low cost solar panels, but micro-grid energy systems that use multiple fuel stocks that can power rural villages and towns and not a Carbon Tax.
- If we cut our waste, we cut CO2 emissions. This makes the CO2 emissions benchmark useless and to be honest the arguments based on climate change and CO2 are weak.
- Stop the 100 % renewable myth (all the above approach).
I have never recommended a book to read – this is the first, but I strongly recommend “Scare Pollution“, 2016.
I also like “Human Caused Global Warming“, but I really wish the author hired and used an editor.
“Unsettled: What Climate Science Tells Us, What It Doesn’t, and Why It Matters”
I really enjoyed – “Global Warming-Alarmists, Skeptics and Deniers: A Geoscientist Looks at the Science of Climate Change“
Posted by Brian on June 19, 2017 · Leave a Comment
Could plate tectonics be tied to the development of life on Earth?
Earth is the only planet known to sustain life. It is also the only planet with active plate tectonics. Coincidence? Most geoscientists think not. In part two of EARTH Magazine’s feature on plate tectonics, EARTH correspondent Mary Caperton Morton examines the links between two phenomena that are unique to our planet.
Although other planets in our solar system possess active volcanoes, faults, and other evidence of surface deformation, Earth’s global plate tectonics is “a very rare animal,” according to Chris Hawkesworth, a geochemist at the University of Bristol in England. And life beyond our planet is rarer still.
The key ingredient for both seems to be water: Aqueous environments spawned the first single-celled organisms, and minerals become weaker when water is embedded in their crystalline structure – weak enough for Earth’s eggshell crust to crack. The development of complex life appears even more closely tied to tectonics, and that may just be a missing piece in the evolutionary puzzle.
Read part two of the plate tectonics double-feature in EARTH Magazine, now online.
The July issue of EARTH is now available online. Read the cover story, “Burying the Sky,” to learn how two projects – one in Iceland, the other in eastern Washington state – are taking advantage of their common underlying geology to capture and store greenhouse gases as carbonate rock. For these stories and more, The Conversation
« Previous Page — Next Page »


